【Python】New York City Taxi Trip Duration纽约出租车大数据探索(技术实现过程)_nyc出租车聚类python-程序员宅基地
# New York City Taxi Trip Duration纽约出租车大数据探索
# 该项目来源于Kaggle,旨在建模来预测纽约出租车在行程中的总行驶时间。
# 在建模预测的过程中,我们可以顺便探索纽约市民打车出行习惯及其他有效信息。
# kaggle项目链接  https://www.kaggle.com/c/nyc-taxi-trip-duration/overview

# 本文内容结构说明:

# 一、先参考简书帖子《纽约出租车大数据探索》完成一部分探索,帖子没有源代码,所以我会根据帖子思路,自行写出代码。
# 帖子网址 https://www.jianshu.com/p/1da53849a314

# 二、按照帖子文末提出的可以进一步拓展的探索方向,自行深入探索。

# 三、kaggle比赛目标之预测行程持续时间,另外再开帖子叙述。
# 一、先参照简书帖子

# 帖子的结构为五部分:
# 1、提出问题—2、理解数据——3、数据清理——4、数据分析—5、得出结论
# 1、提出问题(根据已有数据分析)

# (1)何时为打车需求高发期?
# (2)居民夜生活活跃情况?
# (3)城市一天的什么时候最为拥堵?
# (4)什么时间容易接到长途单?
# 2、理解数据(表单说明)

# id - 每次行程的唯一ID
# vendor_id - 行程提供者的ID
# pickup_datetime - 上车的日期和时间
# dropoff_datetime - 停表的日期和时间
# passenger_count - 车辆中的乘客数量(驾驶员输入值)
# pickup_longitude - 上车的经度
# pickup_latitude - 上车的纬度
# dropoff_longitude - 下车经度
# dropoff_latitude - 下车的纬度
# store_and_fwd_flag - 行程记录是否为存储转发(或是直接发送)-- Y =存储和转发 N =没有存储
# trip_duration - 行程持续时间(秒)
# 3、数据清理

# Basic packages
import numpy as np
import pandas as pd

# Viz
import matplotlib.pyplot as plt
import seaborn as sns

# settings
import warnings
warnings.filterwarnings("ignore")
# 导入数据
train=pd.read_csv(r"D:\2018_BigData\Python\Kaggle_learning\New York City Taxi Trip Duration\train.csv")
train.head()
| id | vendor_id | pickup_datetime | dropoff_datetime | passenger_count | pickup_longitude | pickup_latitude | dropoff_longitude | dropoff_latitude | store_and_fwd_flag | trip_duration | |
|---|---|---|---|---|---|---|---|---|---|---|---|
| 0 | id2875421 | 2 | 2016-03-14 17:24:55 | 2016-03-14 17:32:30 | 1 | -73.982155 | 40.767937 | -73.964630 | 40.765602 | N | 455 |
| 1 | id2377394 | 1 | 2016-06-12 00:43:35 | 2016-06-12 00:54:38 | 1 | -73.980415 | 40.738564 | -73.999481 | 40.731152 | N | 663 |
| 2 | id3858529 | 2 | 2016-01-19 11:35:24 | 2016-01-19 12:10:48 | 1 | -73.979027 | 40.763939 | -74.005333 | 40.710087 | N | 2124 |
| 3 | id3504673 | 2 | 2016-04-06 19:32:31 | 2016-04-06 19:39:40 | 1 | -74.010040 | 40.719971 | -74.012268 | 40.706718 | N | 429 |
| 4 | id2181028 | 2 | 2016-03-26 13:30:55 | 2016-03-26 13:38:10 | 1 | -73.973053 | 40.793209 | -73.972923 | 40.782520 | N | 435 |
train.info()

# 从下表看到,数据比较完整。看Kaggle官网也说了,因为是playground项目,所以已经把数据cleaned了。
<class 'pandas.core.frame.DataFrame'>
RangeIndex: 1458644 entries, 0 to 1458643
Data columns (total 11 columns):
id                    1458644 non-null object
vendor_id             1458644 non-null int64
pickup_datetime       1458644 non-null object
dropoff_datetime      1458644 non-null object
passenger_count       1458644 non-null int64
pickup_longitude      1458644 non-null float64
pickup_latitude       1458644 non-null float64
dropoff_longitude     1458644 non-null float64
dropoff_latitude      1458644 non-null float64
store_and_fwd_flag    1458644 non-null object
trip_duration         1458644 non-null int64
dtypes: float64(4), int64(3), object(4)
memory usage: 122.4+ MB
train.describe()

# 看下表,全部是科学计数法,影响观察。
| vendor_id | passenger_count | pickup_longitude | pickup_latitude | dropoff_longitude | dropoff_latitude | trip_duration | |
|---|---|---|---|---|---|---|---|
| count | 1.458644e+06 | 1.458644e+06 | 1.458644e+06 | 1.458644e+06 | 1.458644e+06 | 1.458644e+06 | 1.458644e+06 |
| mean | 1.534950e+00 | 1.664530e+00 | -7.397349e+01 | 4.075092e+01 | -7.397342e+01 | 4.075180e+01 | 9.594923e+02 |
| std | 4.987772e-01 | 1.314242e+00 | 7.090186e-02 | 3.288119e-02 | 7.064327e-02 | 3.589056e-02 | 5.237432e+03 |
| min | 1.000000e+00 | 0.000000e+00 | -1.219333e+02 | 3.435970e+01 | -1.219333e+02 | 3.218114e+01 | 1.000000e+00 |
| 25% | 1.000000e+00 | 1.000000e+00 | -7.399187e+01 | 4.073735e+01 | -7.399133e+01 | 4.073588e+01 | 3.970000e+02 |
| 50% | 2.000000e+00 | 1.000000e+00 | -7.398174e+01 | 4.075410e+01 | -7.397975e+01 | 4.075452e+01 | 6.620000e+02 |
| 75% | 2.000000e+00 | 2.000000e+00 | -7.396733e+01 | 4.076836e+01 | -7.396301e+01 | 4.076981e+01 | 1.075000e+03 |
| max | 2.000000e+00 | 9.000000e+00 | -6.133553e+01 | 5.188108e+01 | -6.133553e+01 | 4.392103e+01 | 3.526282e+06 |
# 尝试不以科学计数法显示。

# np.set_printoptions(suppress=True)
pd.set_option('display.max_columns', None)
train[["passenger_count","trip_duration"]].describe()

# 暂不成功。因为整体数据比较完整,接下来直接可视化分析。
| passenger_count | trip_duration | |
|---|---|---|
| count | 1.458644e+06 | 1.458644e+06 |
| mean | 1.664530e+00 | 9.594923e+02 |
| std | 1.314242e+00 | 5.237432e+03 |
| min | 0.000000e+00 | 1.000000e+00 |
| 25% | 1.000000e+00 | 3.970000e+02 |
| 50% | 1.000000e+00 | 6.620000e+02 |
| 75% | 2.000000e+00 | 1.075000e+03 |
| max | 9.000000e+00 | 3.526282e+06 |
# 4、 数据分析与可视化

# (1)何时为打车需求高发期?
# (2)居民夜生活活跃情况?
# (3)城市一天的什么时候最为拥堵?
# (4)什么时间容易接到长途单?
# 分析一:何时为打车需求高发期?

import datetime
from datetime import datetime

# dt = train["pickup_datetime"]
# dt = datetime.strptime(dt, '%Y-%m-%d %H:%M:%S')
# train["pickup_month"] = dt.month

train.pickup_datetime = train.pickup_datetime.apply(lambda x:datetime.strptime(x, '%Y-%m-%d %H:%M:%S'))
train["pickup_yearmonth"] = train["pickup_datetime"].map(lambda x: 100*x.year + x.month)
train.head(1)

# 另外,年份月份提取也可以用astpye函数,例如[M]转换成月份:参考 df["month"]=df.DealTime.values.astype("datetime64[M]")
# 还可以提取星期几的周信息。
| id | vendor_id | pickup_datetime | dropoff_datetime | passenger_count | pickup_longitude | pickup_latitude | dropoff_longitude | dropoff_latitude | store_and_fwd_flag | trip_duration | pickup_yearmonth | |
|---|---|---|---|---|---|---|---|---|---|---|---|---|
| 0 | id2875421 | 2 | 2016-03-14 17:24:55 | 2016-03-14 17:32:30 | 1 | -73.982155 | 40.767937 | -73.96463 | 40.765602 | N | 455 | 201603 |
train["pickup_yearmonth"].value_counts()

# 只有六个月的时间数据。
201603    256189
201604    251645
201605    248487
201602    238300
201606    234316
201601    229707
Name: pickup_yearmonth, dtype: int64
# 新增月份
# train.drop(["pickup_yearmonth"],axis=1,inplace=True)
train["pickup_month"] = train["pickup_datetime"].map(lambda x: x.month)

# train.dropoff_datetime = train.dropoff_datetime.apply(lambda x:datetime.strptime(x, '%Y-%m-%d %H:%M:%S'))
# train["dropoff_month"] = train["dropoff_datetime"].map(lambda x: x.month)

train.head(1)

# 其实dropoff_month和pickup_month基本一致,如果考虑到效率和内存,可以不用提取dropoff_month。
| id | vendor_id | pickup_datetime | dropoff_datetime | passenger_count | pickup_longitude | pickup_latitude | dropoff_longitude | dropoff_latitude | store_and_fwd_flag | trip_duration | pickup_yearmonth | pickup_month | |
|---|---|---|---|---|---|---|---|---|---|---|---|---|---|
| 0 | id2875421 | 2 | 2016-03-14 17:24:55 | 2016-03-14 17:32:30 | 1 | -73.982155 | 40.767937 | -73.96463 | 40.765602 | N | 455 | 201603 | 3 |
# 新增周标识

# train["week"]=train.pickup_datetime.weekday()
# AttributeError: 'Series' object has no attribute 'datetime'

train["pickup_week"]=train.pickup_datetime.apply(lambda x: x.weekday())
train.head(2)
| id | vendor_id | pickup_datetime | dropoff_datetime | passenger_count | pickup_longitude | pickup_latitude | dropoff_longitude | dropoff_latitude | store_and_fwd_flag | trip_duration | pickup_yearmonth | pickup_month | pickup_week | |
|---|---|---|---|---|---|---|---|---|---|---|---|---|---|---|
| 0 | id2875421 | 2 | 2016-03-14 17:24:55 | 2016-03-14 17:32:30 | 1 | -73.982155 | 40.767937 | -73.964630 | 40.765602 | N | 455 | 201603 | 3 | 0 |
| 1 | id2377394 | 1 | 2016-06-12 00:43:35 | 2016-06-12 00:54:38 | 1 | -73.980415 | 40.738564 | -73.999481 | 40.731152 | N | 663 | 201606 | 6 | 6 |
train["pickup_day"]=train.pickup_datetime.apply(lambda x: x.day)
train.head(2)
| id | vendor_id | pickup_datetime | dropoff_datetime | passenger_count | pickup_longitude | pickup_latitude | dropoff_longitude | dropoff_latitude | store_and_fwd_flag | trip_duration | pickup_yearmonth | pickup_month | pickup_week | pickup_day | |
|---|---|---|---|---|---|---|---|---|---|---|---|---|---|---|---|
| 0 | id2875421 | 2 | 2016-03-14 17:24:55 | 2016-03-14 17:32:30 | 1 | -73.982155 | 40.767937 | -73.964630 | 40.765602 | N | 455 | 201603 | 3 | 0 | 14 |
| 1 | id2377394 | 1 | 2016-06-12 00:43:35 | 2016-06-12 00:54:38 | 1 | -73.980415 | 40.738564 | -73.999481 | 40.731152 | N | 663 | 201606 | 6 | 6 | 12 |
# 新增日标识
train["pickup_date"]=train.pickup_datetime.values.astype("datetime64[D]")
train.head(2)
| id | vendor_id | pickup_datetime | dropoff_datetime | passenger_count | pickup_longitude | pickup_latitude | dropoff_longitude | dropoff_latitude | store_and_fwd_flag | trip_duration | pickup_yearmonth | pickup_month | pickup_week | pickup_day | pickup_date | |
|---|---|---|---|---|---|---|---|---|---|---|---|---|---|---|---|---|
| 0 | id2875421 | 2 | 2016-03-14 17:24:55 | 2016-03-14 17:32:30 | 1 | -73.982155 | 40.767937 | -73.964630 | 40.765602 | N | 455 | 201603 | 3 | 0 | 14 | 2016-03-14 |
| 1 | id2377394 | 1 | 2016-06-12 00:43:35 | 2016-06-12 00:54:38 | 1 | -73.980415 | 40.738564 | -73.999481 | 40.731152 | N | 663 | 201606 | 6 | 6 | 12 | 2016-06-12 |
month_trip=train.groupby(['pickup_month'])["trip_duration"].agg(["sum","mean","count"])
month_trip=month_trip.reset_index()
month_trip.head(2)
| pickup_month | sum | mean | count | |
|---|---|---|---|---|
| 0 | 1 | 211875608 | 922.373319 | 229707 |
| 1 | 2 | 219433897 | 920.830453 | 238300 |
# 为了直观一些,改列名
month_trip.rename(columns={
    'sum':'month_sum_trip_dur','mean':'month_avg_trip_dur','count':"month_trip_times"}, inplace = True)
month_trip.head(2)
| pickup_month | month_sum_trip_dur | month_avg_trip_dur | month_trip_times | |
|---|---|---|---|---|
| 0 | 1 | 211875608 | 922.373319 | 229707 |
| 1 | 2 | 219433897 | 920.830453 | 238300 |
date_trip=train.groupby(['pickup_date'])["trip_duration"].agg(["sum","mean","count"])
date_trip=date_trip.reset_index()
date_trip.rename(columns={
    'sum':'date_sum_trip_duration','mean':'date_avg_trip_dur','count':"date_trip_times"}, inplace = True)
date_trip.head()
| pickup_date | date_sum_trip_duration | date_avg_trip_dur | date_trip_times | |
|---|---|---|---|---|
| 0 | 2016-01-01 | 6593910 | 920.679978 | 7162 |
| 1 | 2016-01-02 | 5470632 | 840.084767 | 6512 |
| 2 | 2016-01-03 | 5874410 | 924.667086 | 6353 |
| 3 | 2016-01-04 | 5723773 | 851.118662 | 6725 |
| 4 | 2016-01-05 | 10484304 | 1455.344808 | 7204 |
day_trip=train.groupby(['pickup_day'])["trip_duration"].agg(["sum","mean","count"])
day_trip=day_trip.reset_index()
day_trip.rename(columns={
    'sum':'day_sum_trip_duration','mean':'day_avg_trip_dur','count':"day_trip_times"}, inplace = True)
day_trip.head()
| pickup_day | day_sum_trip_duration | day_avg_trip_dur | day_trip_times | |
|---|---|---|---|---|
| 0 | 1 | 44656812 | 958.053978 | 46612 |
| 1 | 2 | 44354937 | 928.860299 | 47752 |
| 2 | 3 | 46806173 | 976.247221 | 47945 |
| 3 | 4 | 47050568 | 947.549451 | 49655 |
| 4 | 5 | 51193213 | 1020.272899 | 50176 |
# plot
plt.figure(figsize=(16,18))
plt.subplot(321)
ax1= plt.plot(month_trip.pickup_month, month_trip.month_trip_times, color="green", alpha=0.8, label='trip times',marker='*')
plt.title("Monthly Trip Times")
plt.ylabel('# of trip times', fontsize=12)
plt.xlabel('Pickup_Month', fontsize=12)
plt.subplot(322)
ax2= plt.plot(month_trip.pickup_month, month_trip.month_avg_trip_dur, color="green",alpha=0.8,marker='o')
plt.title("Monthly Trip Duration")
plt.ylabel('Avg of trip druration', fontsize=12)
plt.xlabel('Pickup_Month', fontsize=12)
plt.subplot(312)
ax2= plt.plot(date_trip.pickup_date, date_trip.date_trip_times, color="red", alpha=0.8,marker='o')
plt.title("Date Trip Time")
plt.ylabel('Date trip time', fontsize=12)
plt.xlabel('Pickup_Date', fontsize=12)
plt.subplot(313)
ax2= plt.plot(day_trip.pickup_day, day_trip.day_trip_times, color="red", alpha=0.8,marker='*')
plt.title("Day Trip Time")
plt.ylabel('Day trip time', fontsize=12)
plt.xlabel('Pickup_Day', fontsize=12)
plt.show()
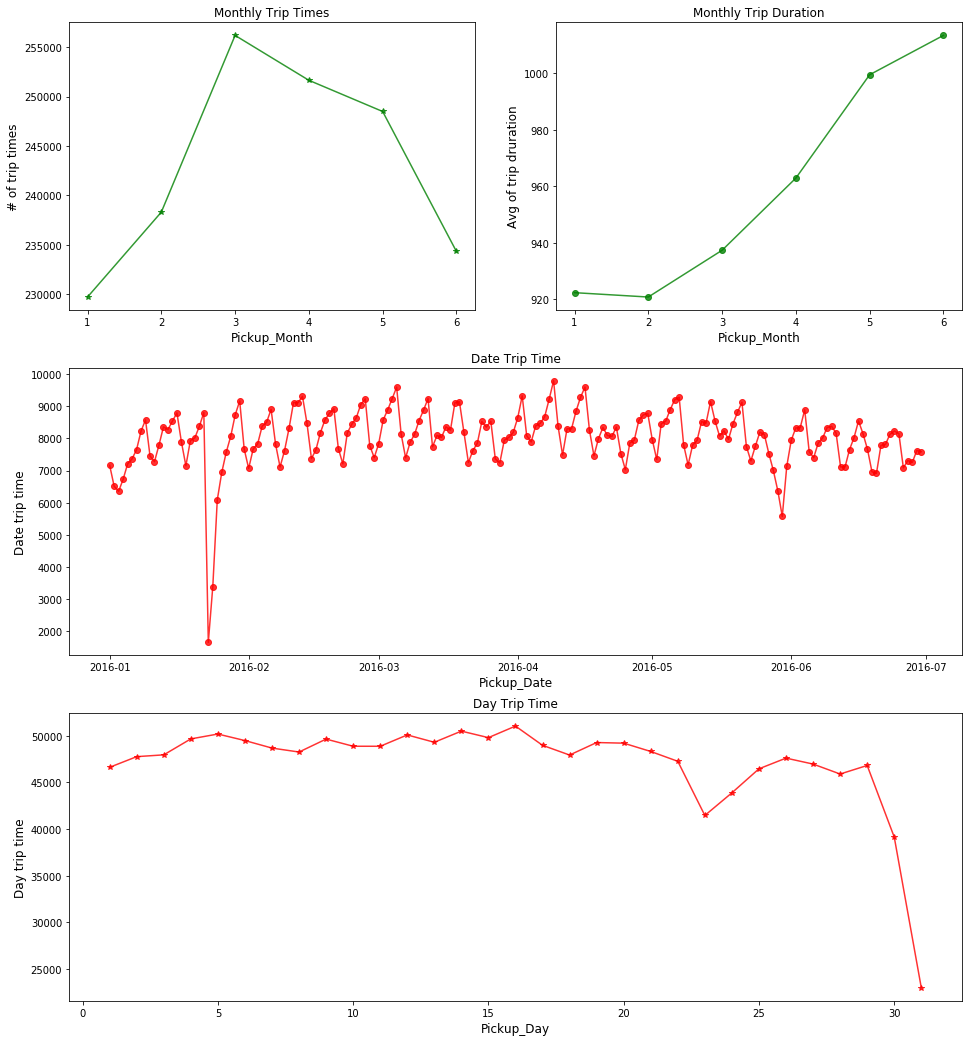
# 从趋势来说,2016年1~6月整体打车时长一直呈增长状态,可能用户逐渐习惯了更远距离也打车。
# 其中,3月-5月订单数量属于六个月中最高的三个月,但是整体下降趋势。
# 1月下旬和5月底有异常点,这两天打车人数特别少,可能是当天发生了什么重大事故,或者是重大节日不出行。
# 从日折线图来看,忽略23号和31号两个异常点,整体订单数量随日期变化呈现规律波动,看似周期为7天(一个星期),据此推测订单数量可能与星期几有关。
# 1、分析异常值

# 从图"Date Trip Time"可以定义异常值临界点为6000,将低于6000的异常值筛选出来。

date_trip[date_trip.date_trip_times<6000]

# 找出异常的日期是1月23日,1月24日,5月30日。
# 分析其原因。根据当日美国新闻:

# (1)美遭暴风雪袭击 纽约时报广场飞雪飘零_网易新闻
# 2016-1-24 · 当地时间2016年1月23日,美国纽约,美国遭遇暴雪天气,暴雪中的时报广场。

# (2)阵亡将士纪念日 (5月的最后一个星期一)
# 中新网5月30日电 据美媒报道,美国迎来“国殇日”长周末,标志着夏季的正式开始。
| pickup_date | date_sum_trip_duration | date_avg_trip_dur | date_trip_times | |
|---|---|---|---|---|
| 22 | 2016-01-23 | 1691754 | 1026.549757 | 1648 |
| 23 | 2016-01-24 | 3052107 | 902.189477 | 3383 |
| 150 | 2016-05-30 | 4568228 | 820.148654 | 5570 |
# 2、分析订单数量可能和星期几有关
x = train.groupby(['pickup_day'])["passenger_count"].agg(["mean"])
x = x.reset_index()
day_trip["avg_passenger_count"] = x["mean"]
day_trip.head()
| pickup_day | day_sum_trip_duration | day_avg_trip_dur | day_trip_times | avg_passenger_count | |
|---|---|---|---|---|---|
| 0 | 1 | 44656812 | 958.053978 | 46612 | 1.682871 |
| 1 | 2 | 44354937 | 928.860299 | 47752 | 1.666611 |
| 2 | 3 | 46806173 | 976.247221 | 47945 | 1.655355 |
| 3 | 4 | 47050568 | 947.549451 | 49655 | 1.643279 |
| 4 | 5 | 51193213 | 1020.272899 | 50176 | 1.670301 |
plt.figure(figsize=(12,12))
plt.subplot(211)
ax2= plt.plot(day_trip.pickup_day, day_trip.avg_passenger_count, color="grey", alpha=0.8,marker='o')
plt.title("Day Trip Passenger")
plt.ylabel('Day trip passenger', fontsize=12)
plt.xlabel('Pickup_Day', fontsize=12)
plt.subplot(212)
ax2= plt.plot(day_trip.pickup_day, day_trip.day_trip_times, color="grey", alpha=0.9,marker='*')
plt.title("Day Trip Time")
plt.ylabel('Day trip time', fontsize=12)
plt.xlabel('Pickup_Day', fontsize=12)
plt.show()
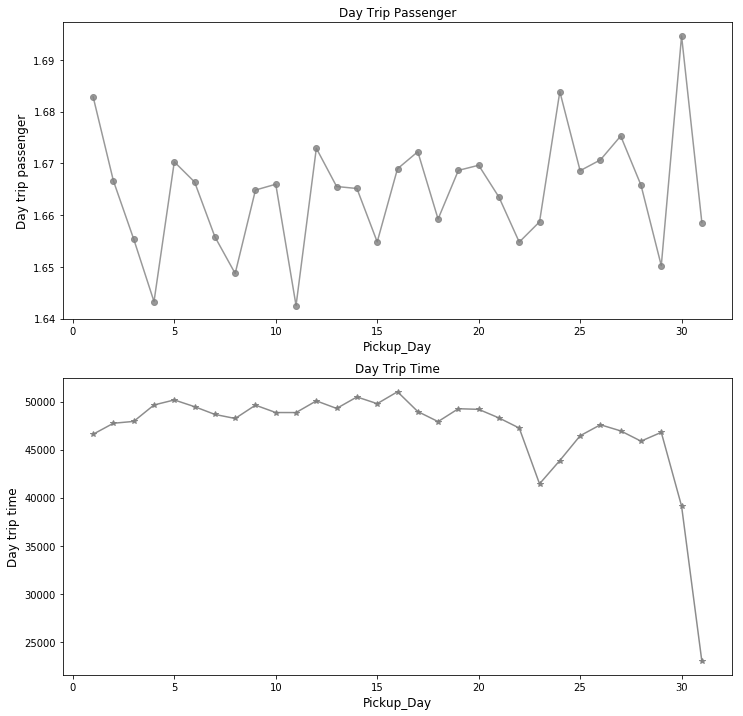
# 两张图展示了在2016年1月1日至2016年6月30日这半年内,六个月1~31日的每日订单总量、每日平均乘车人数随日期的波动。
# 两个图(每日订单数量/乘车次数与日平均乘车人数)的趋势惊人地一致。这说明在周期的某一阶段,不仅订单数量增多,而且人们偏向于结伴出行。
train["pickup_hour"]=train.pickup_datetime.apply(lambda x: x.hour)
train.head()
| id | vendor_id | pickup_datetime | dropoff_datetime | passenger_count | pickup_longitude | pickup_latitude | dropoff_longitude | dropoff_latitude | store_and_fwd_flag | trip_duration | pickup_yearmonth | pickup_month | pickup_week | pickup_day | pickup_date | pickup_hour | |
|---|---|---|---|---|---|---|---|---|---|---|---|---|---|---|---|---|---|
| 0 | id2875421 | 2 | 2016-03-14 17:24:55 | 2016-03-14 17:32:30 | 1 | -73.982155 | 40.767937 | -73.964630 | 40.765602 | N | 455 | 201603 | 3 | 0 | 14 | 2016-03-14 | 17 |
| 1 | id2377394 | 1 | 2016-06-12 00:43:35 | 2016-06-12 00:54:38 | 1 | -73.980415 | 40.738564 | -73.999481 | 40.731152 | N | 663 | 201606 | 6 | 6 | 12 | 2016-06-12 | 0 |
| 2 | id3858529 | 2 | 2016-01-19 11:35:24 | 2016-01-19 12:10:48 | 1 | -73.979027 | 40.763939 | -74.005333 | 40.710087 | N | 2124 | 201601 | 1 | 1 | 19 | 2016-01-19 | 11 |
| 3 | id3504673 | 2 | 2016-04-06 19:32:31 | 2016-04-06 19:39:40 | 1 | -74.010040 | 40.719971 | -74.012268 | 40.706718 | N | 429 | 201604 | 4 | 2 | 6 | 2016-04-06 | 19 |
| 4 | id2181028 | 2 | 2016-03-26 13:30:55 | 2016-03-26 13:38:10 | 1 | -73.973053 | 40.793209 | -73.972923 | 40.782520 | N | 435 | 201603 | 3 | 5 | 26 | 2016-03-26 | 13 |
# pc=train["passenger_count"]
# phour=train["pickup_hour"]
# pday=train["pickup_day"]
# pweek=train["pickup_week"]
# pmonth=train["pickup_month"]
# pdate=train["pickup_date"]
# tripdur=train["trip_duration"]

# sns.swarmplot(x="pweek", y="tripdur", hue="pmonth", data=train)

# 如上先赋值再代入函数,则swarmplot函数运行报错。下面尝试直接代入函数。

# sns.swarmplot(x=train["pickup_week"], y=train["trip_duration"], hue=train["pickup_month"], data=train)
# sns.swarmplot(x="pickup_week", y="trip_duration", hue="pickup_month", data=train)
# 这两句语句都运行过久,30分钟未有反应,暂时放弃该语句,再寻找其他较优语句。
week_trip = train.groupby(["pickup_month",'pickup_week','pickup_day','pickup_hour'])["trip_duration"].agg(["mean","count"])
week_trip = week_trip.reset_index()
week_trip.head(2)
| pickup_month | pickup_week | pickup_day | pickup_hour | mean | count | |
|---|---|---|---|---|---|---|
| 0 | 1 | 0 | 4 | 0 | 656.771186 | 118 |
| 1 | 1 | 0 | 4 | 1 | 703.086957 | 92 |
week_trip.rename(columns={
    'mean':'week_avg_trip_dur','count':"week_trip_times"}, inplace = True)
print(week_trip.shape)
week_trip.head(2)

# 4359行数据,数据量不大,这次可以用sns.swarmplot()函数了。
(4359, 6)
| pickup_month | pickup_week | pickup_day | pickup_hour | week_avg_trip_dur | week_trip_times | |
|---|---|---|---|---|---|---|
| 0 | 1 | 0 | 4 | 0 | 656.771186 | 118 |
| 1 | 1 | 0 | 4 | 1 | 703.086957 | 92 |
# 在week_trip表中增加乘车人数

x1 = train.groupby(["pickup_month",'pickup_week','pickup_day','pickup_hour'])["passenger_count"].agg(["mean"])
x1 = x1.reset_index()
week_trip["avg_passenger_count"] = x1["mean"]
week_trip.head()
| pickup_month | pickup_week | pickup_day | pickup_hour | week_avg_trip_dur | week_trip_times | avg_passenger_count | |
|---|---|---|---|---|---|---|---|
| 0 | 1 | 0 | 4 | 0 | 656.771186 | 118 | 1.593220 |
| 1 | 1 | 0 | 4 | 1 | 703.086957 | 92 | 1.673913 |
| 2 | 1 | 0 | 4 | 2 | 692.085106 | 47 | 1.574468 |
| 3 | 1 | 0 | 4 | 3 | 738.500000 | 32 | 1.250000 |
| 4 | 1 | 0 | 4 | 4 | 644.000000 | 50 | 1.700000 |
# 周一至周日打车次数/订单数量

plt.figure(figsize=(10,8))
sns.swarmplot(x="pickup_week", y="week_trip_times", hue="pickup_month", data=week_trip)
plt.show()

# 明显周日周一打车次数最低,周五至周六打车次数最高。可能周四至周六市民出行意愿更高。
# 另外发现,周日打车次数/订单数量在100-300区间内明显比周一至周六多,这里可能蕴含一些信息,待挖掘。

# 周一至周日乘车人数
plt.figure(figsize=(10,5))
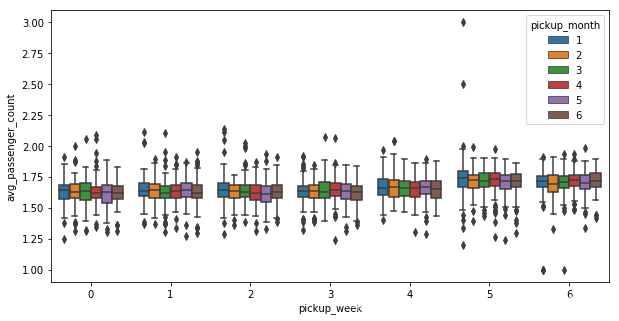
sns.boxplot(x="pickup_week", y="avg_passenger_count", hue="pickup_month", data=week_trip)
plt.show()
# 下图可见,周六周日拼车人数较多。
# 当日内0点至24点乘车次数/订单数量
plt.figure(figsize=(16,6))
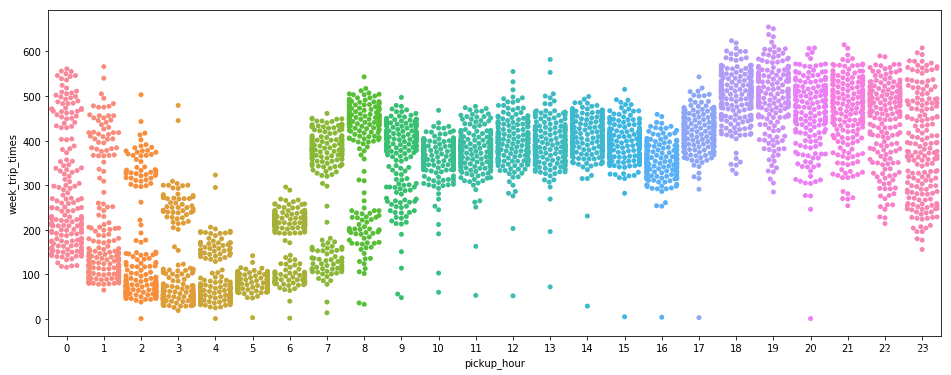
sns.swarmplot(x="pickup_hour", y="week_trip_times", data=week_trip)
plt.show()
# 从图中可以看出:
# (1)全天候分析:
# 凌晨一点开始至凌晨五点,订单数量急剧下降,符合人群休息规律。从早6点开始,订单量由谷底回升,早7点至早9点有一个早高峰。
# 在早8点到下午5点之间有轻微波动不明显。而早10点和下午4点均有一个轻微的走低点。
# 原因推测:
# 1、市民上班的出行需求被公共交通、私家车等分担,不会偏好于出租车出行;
# 2、假设通勤时间1小时,则基本可确定八点至十点是上班时间小集中的时间段。(此结论与原贴不一致,甚至有轻微相反。)
# 3、早八点和下午四点这两个时间点,人群在公司开会尚未外出(早)或已在出差公司开会还未散会(下午四点)。
# (2)晚高峰表现显著:
# 从晚6点开始订单量有大规模增长,约晚7点进入打车最高峰,且在23点之前的平均打车量均维持较高水平,高于白天时段。
# 原因推测:
# 1、相比于白天,市民在晚上外出活动时更偏向于出租车出行。有可能逐渐下班。
# 2、也猜测晚间时间家庭出行或约伴出行,下面通过乘车人数认证后发现该假设并不成立。
# (3)下午时段,四点左右出现订单量回落。
# 原因推测:
# 1、司机交班;2、道路拥堵;3、出差人群在出差公司开会还未散会下班。
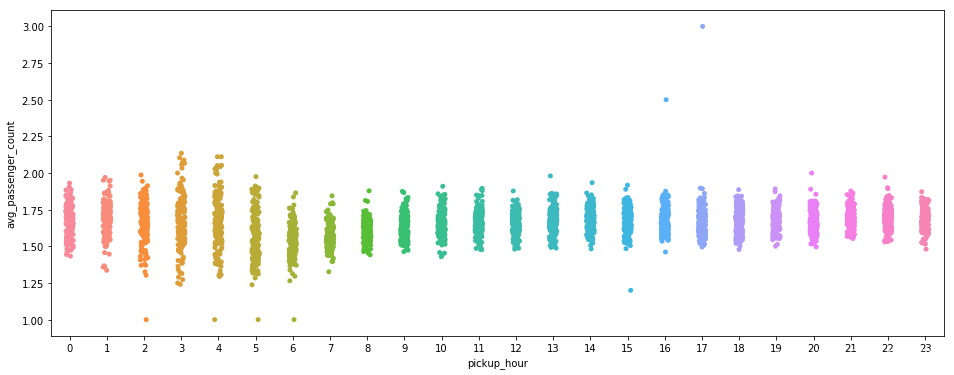
# 当日内0点至24点乘车人数

plt.figure(figsize=(16,6))
sns.stripplot(x="pickup_hour", y="avg_passenger_count", data=week_trip)
plt.show()

# 前面猜测晚间时间家庭出行或约伴出行,这里乘车人数在晚间并无明显变化,故前面猜测不成立。
# 反而发现凌晨2点至5点订单乘车人数较为分散,既有较多人(约伴),也有较少人(单人)的情况。
# 早5点-8点之间,每个订单乘车人数全日最低(boxplot比较清晰,stripplot没那么清晰),恰好又是上班时间,预计是单人上班打车情况较多。
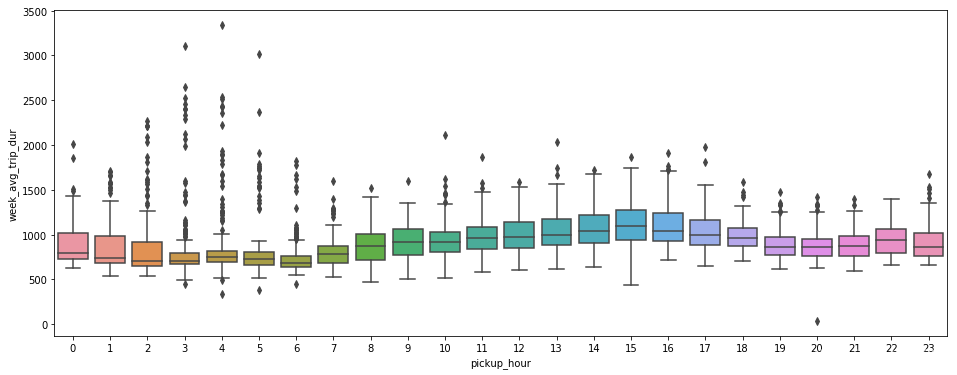
# 当日内0点至24点打车行程时间分布

plt.figure(figsize=(16,6))
y=week_trip["week_avg_trip_dur"][week_trip["week_avg_trip_dur"]<=8000]
daytripdur=sns.boxplot(x="pickup_hour", y=y, data=week_trip)
plt.show()

# 一开始发现三个异常值干扰观察,尝试增加boxplot函数中参数y的重新赋值来忽略异常值(week_avg_trip_dur>8000)。——下图为已修正三个异常值。

# 白天早9点至下午5点,行车时间较长,据此可以推测白天这个时间段道路较为拥塞。

# 凌晨2点至5点,基本可以排除拥塞影响,行程时间长短可近似等同于距离长短。且分布在箱盒之外的长行车时间较多,据此推测:
# 凌晨2点至5点这个时间段接到长距离行程单的机会比其他时间段多很多。

# 分析二:居民夜生活活跃情况?

# 订单数量在晚8点至凌晨1点均维持较高水平,从凌晨1点开始,订单量断崖式下跌,这一下跌持续到约早5点,早5点是一天内订单量最低的时刻。
# 说明纽约市民夜生活活跃情况:
# (1)第一种可能:下午/晚上下班后约伴交友灯红酒绿夜夜笙歌,至凌晨1点方歇。
# (2)当然,也有第二种可能是:晚晚加班。白天会议下午法定下班时间后,才是晚间工作的开始,然后陆陆续续持续到凌晨十二点。
# 从国情看,纽约的第一种可能性高一些;而第二种则在中国一线城市发生的概率比率高一些。
# 分析三: 城市的一天什么时候最为拥堵?

# 第一个思路(如下图):
# 从前面分析第一部分的“当日内0点至24点打车行程时间分布”初步推测:
# 白天早9点至下午5点,行车时间较长,据此可以推测白天这个时间段道路较为拥塞。

# 第二个思路(待挖掘):
# 先通过上下车地点经纬度计算行程距离,再用行程距离/行程时间得出行车均速。行程均速可体现道路畅通拥堵程度。

plt.figure(figsize=(16,6))
# y=week_trip["week_avg_trip_dur"][week_trip["week_avg_trip_dur"]<=8000]
daytripdur=sns.boxplot(x="pickup_hour", y=y, data=week_trip)
plt.show()
# 计算行程距离

from math import sin,radians,cos,asin,sqrt

def haversine(lon1, lat1, lon2, lat2):

    lon1, lat1, lon2, lat2 = map(radians, [lon1, lat1, lon2, lat2]) #radians 角度转弧度

    dlon = lon2 - lon1
    dlat = lat2 - lat1
    a = sin(dlat/2)**2 + cos(lat1) * cos(lat2) * sin(dlon/2)**2
    c = 2 * asin(sqrt(a)) # 反正弦
    r = 6371
    return c * r


# EARTH_REDIUS = 6378.137

# def rad(d):
#     return d * pi / 180.0

# def getDistance(lat1, lng1, lat2, lng2):
#     radLat1 = rad(lat1)
#     radLat2 = rad(lat2)
#     a = radLat1 - radLat2
#     b = rad(lng1) - rad(lng2)
#     s = 2 * math.asin(math.sqrt(math.pow(math.sin(a/2), 2) + math.cos(radLat1) * math.cos(radLat2) * math.pow(math.sin(b/2), 2)))
#     s = s * EARTH_REDIUS
#     return s
# train["distance"] = train['pickup_longitude', 'pickup_latitude','dropoff_longitude', 'dropoff_latitude'].apply(lambda x: haversine(x))
# 整列计算行程距离的方法,暂时搁置。(未完待续)
# 分析四:什么时间容易接到长途单?

# 接单时间和订单行程时间/路程距离是否有关系呢?接下来进入分析。
# 前面已经绘出一日内0点至24点的平均行程时间,我们这里重新引用:

plt.figure(figsize=(16,6))
y=week_trip["week_avg_trip_dur"][week_trip["week_avg_trip_dur"]<=8000]
daytripdur=sns.boxplot(x="pickup_hour", y=y, data=week_trip)
plt.show()


# 凌晨2点至5点,基本可以排除拥塞影响,行程时间长短可近似等同于距离长短。且分布在箱盒之外的长行车时间较多,据此推测:
# 凌晨2点至5点这个时间段接到长距离行程单的机会比其他时间段多很多。

# 总结

# 分析到此告一段落。当然,虽然数据量不多,但是还可以挖掘更细致的城市出行行为等信息。

# 例如,
# 可以分析哪些时段的哪些区域更容易发生订单,人群一般从哪些地方去往哪些地方——这对出租调度来说是个有效数据。
# 从暴雪带来的异常值可以推测,天气与订单量是有密切关系的,根据日期对应天气数据,可以进一步分析天气与订单量的影响。
# 结合位置数据,还可以分析哪些区域受天气的影响较大,等等。
智能推荐
2024最新计算机毕业设计选题大全-程序员宅基地
文章浏览阅读1.6k次,点赞12次,收藏7次。大家好!大四的同学们毕业设计即将开始了,你们做好准备了吗?学长给大家精心整理了最新的计算机毕业设计选题,希望能为你们提供帮助。如果在选题过程中有任何疑问,都可以随时问我,我会尽力帮助大家。在选择毕业设计选题时,有几个要点需要考虑。首先,选题应与计算机专业密切相关,并且符合当前行业的发展趋势。选择与专业紧密结合的选题,可以使你们更好地运用所学知识,并为未来的职业发展奠定基础。要考虑选题的实际可行性和创新性。选题应具备一定的实践意义和应用前景,能够解决实际问题或改善现有技术。
dcn网络与公网_电信运营商DCN网络的演变与规划方法(The evolution and plan method of DCN)...-程序员宅基地
文章浏览阅读3.4k次。摘要:随着电信业务的发展和电信企业经营方式的转变,DCN网络的定位发生了重大的演变。本文基于这种变化,重点讨论DCN网络的规划方法和运维管理方法。Digest: With the development oftelecommunication bussiness and the change of management of telecomcarrier , DCN’s role will cha..._电信dcn
动手深度学习矩阵求导_向量变元是什么-程序员宅基地
文章浏览阅读442次。深度学习一部分矩阵求导知识的搬运总结_向量变元是什么
月薪已炒到15w?真心建议大家冲一冲数据新兴领域,人才缺口极大!-程序员宅基地
文章浏览阅读8次。近期,裁员的公司越来越多今天想和大家聊聊职场人的新出路。作为席卷全球的新概念ESG已然成为当前各个行业关注的最热风口目前,国内官方发布了一项ESG新证书含金量五颗星、中文ESG证书、完整ESG考试体系、名师主讲...而ESG又是与人力资源直接相关甚至在行业圈内成为大佬们的热门话题...当前行业下行,裁员的公司也越来越多大家还是冲一冲这个新兴领域01 ESG为什么重要?在双碳的大背景下,ESG已然成...
对比传统运营模式,为什么越拉越多的企业选择上云?_系统上云的前后对比-程序员宅基地
文章浏览阅读356次。云计算快速渗透到众多的行业,使中小企业受益于技术变革。最近微软SMB的一项研究发现,到今年年底,78%的中小企业将以某种方式使用云。企业希望投入少、收益高,来取得更大的发展机会。云计算将中小企业信息化的成本大幅降低,它们不必再建本地互联网基础设施,节省时间和资金,降低了企业经营风险。科技创新已成时代的潮流,中小企业上云是创新前提。云平台稳定、安全、便捷的IT环境,提升企业经营效率的同时,也为企业..._系统上云的前后对比
esxi网卡直通后虚拟机无网_esxi虚拟机无法联网-程序员宅基地
文章浏览阅读899次。出现选网卡的时候无法选中,这里应该是一个bug。3.保存退出,重启虚拟机即可。1.先随便选择一个网卡。2.勾先取消再重新勾选。_esxi虚拟机无法联网
随便推点
在LaTeX中使用.bib文件统一管理参考文献_egbib-程序员宅基地
文章浏览阅读913次。在LaTeX中,可在.tex文件的同一级目录下创建egbib.bib文件,所有的参考文件信息可以统一写在egbib.bib文件中,然后在.tex文件的\end{document}前加入如下几行代码:{\small\bibliographystyle{IEEEtran}\bibliography{egbib}}即可在文章中用~\cite{}宏命令便捷的插入文内引用,且文章的Reference部分会自动排序、编号。..._egbib
Unity Shader - Predefined Shader preprocessor macros 着色器预处理宏-程序员宅基地
文章浏览阅读950次。目录:Unity Shader - 知识点目录(先占位,后续持续更新)原文:Predefined Shader preprocessor macros版本:2019.1Predefined Shader preprocessor macros着色器预处理宏Unity 编译 shader programs 期间的一些预处理宏。(本篇的宏介绍随便看看就好,要想深入了解,还是直接看Unity...
大数据平台,从“治理”数据谈起-程序员宅基地
文章浏览阅读195次。本文目录:一、大数据时代还需要数据治理吗?二、如何面向用户开展大数据治理?三、面向用户的自服务大数据治理架构四、总结一、大数据时代还需要数据治理吗?数据平台发展过程中随处可见的数据问题大数据不是凭空而来,1981年第一个数据仓库诞生,到现在已经有了近40年的历史,相对数据仓库来说我还是个年轻人。而国内企业数据平台的建设大概从90年代末就开始了,从第一代架构出现到..._数据治理从0搭建
大学抢课python脚本_用彪悍的Python写了一个自动选课的脚本 | 学步园-程序员宅基地
文章浏览阅读2.2k次,点赞4次,收藏12次。高手请一笑而过。物理实验课别人已经做过3、4个了,自己一个还没做呢。不是咱不想做,而是咱不想起那么早,并且仅有的一次起得早,但是哈工大的服务器竟然超负荷,不停刷新还是不行,不禁感慨这才是真正的“万马争过独木桥“啊!服务器不给力啊……好了,废话少说。其实,我的想法很简单。写一个三重循环,不停地提交,直到所有的数据都accepted。其中最关键的是提交最后一个页面,因为提交用户名和密码后不需要再访问其..._哈尔滨工业大学抢课脚本
english_html_study english html-程序员宅基地
文章浏览阅读4.9k次。一些别人收集的英文站点 http://www.lifeinchina.cn (nice) http://www.huaren.us/ (nice) http://www.hindu.com (okay) http://www.italki.com www.talkdatalk.com (transfer)http://www.en8848.com.cn/yingyu/index._study english html
Cortex-M3双堆栈MSP和PSP_stm32 msp psp-程序员宅基地
文章浏览阅读5.5k次,点赞19次,收藏78次。什么是栈?在谈M3堆栈之前我们先回忆一下数据结构中的栈。栈是一种先进后出的数据结构(类似于枪支的弹夹,先放入的子弹最后打出,后放入的子弹先打出)。M3内核的堆栈也不例外,也是先进后出的。栈的作用?局部变量内存的开销,函数的调用都离不开栈。了解了栈的概念和基本作用后我们来看M3的双堆栈栈cortex-M3内核使用了双堆栈,即MSP和PSP,这极大的方便了OS的设计。MSP的含义是Main..._stm32 msp psp