Prometheus监控kubernetes中容器的性能指标并展示_性能测试promtheus部署完成可以监控所有容器pod以及集群节点么?-程序员宅基地
技术标签: kubernetes 监控程序 java相关 elasticsearch 运维 中间件
业务场景
- 现在有一个平台,用户可以在平台上创建任务,对于每个任务,平台会通过kubernetes来创建一个容器;
- 任务会运行很久,可能有好几天。用户需要在当前平台方便地查看任务的各项资源使用指标,以便能知道任务是否运行正常,或者根据指标来及时调整任务的参数等;
- 用户只需要查看自己创建的任务的容器指标,而且只需要某几个重要的指标;
- 管理员可以统一查看所有容器,以及所有机器的性能指标;
涉及技术
| 名称 | 作用 |
| kubernetes | 管理docker容器 |
| docker | 容器 |
| prometheus | 存储监控数据 |
| cadvisor | kubelet自带,采集指标给到prometheus |
| kube-state-metrics | 采集指标给到prometheus |
| openssl | 生成自签名证书 |
| grafana | 将数据以图形方式展现给用户,管理员使用 |
| springboot + HttpClient(后端) | java后端,用于发送请求从prometheus拉取数据 |
| vue + echarts(前端) | 前端框架和组件,用于图形化展示容器资源使用情况 |
- 通过 prometheus + cadvisor + kube-state-metrics 来获取并存储数据;
- 通过 grafana(管理员) + [vue + echart] (普通用户) 来展示图表;

kube-state-metrics 获取监控数据
要让 Prometheus 能监控 kubernetes 中容器的性能指标,需要部署 cadvisor 与 kube-state-metrics。
cadvisor 由 kubelet 自带,所以在安装完 kubernetes 后就已经有了。kube-state-metrics 需要自行部署。
部署完 cadvisor 与 kube-state-metrics 后,在后续部署 prometheus 时,需要在 prometheus.yml 中配置 cadvisor 与 kube-state-metrics。
参考资料:https://github.com/starsliao/Prometheus/tree/master/kubernetes
service-account.yaml
apiVersion: v1
kind: ServiceAccount
metadata:
  labels:
    app.kubernetes.io/name: kube-state-metrics
    app.kubernetes.io/version: v1.9.7
  name: kube-state-metrics
  namespace: ops-monit
cluster-role.yaml
apiVersion: rbac.authorization.k8s.io/v1
kind: ClusterRole
metadata:
  labels:
    app.kubernetes.io/name: kube-state-metrics
    app.kubernetes.io/version: v1.9.7
  name: kube-state-metrics
rules:
- apiGroups:
  - ""
  resources:
  - configmaps
  - secrets
  - nodes
  - pods
  - services
  - resourcequotas
  - replicationcontrollers
  - limitranges
  - persistentvolumeclaims
  - persistentvolumes
  - namespaces
  - endpoints
  verbs:
  - list
  - watch
- apiGroups:
  - extensions
  resources:
  - daemonsets
  - deployments
  - replicasets
  - ingresses
  verbs:
  - list
  - watch
- apiGroups:
  - apps
  resources:
  - statefulsets
  - daemonsets
  - deployments
  - replicasets
  verbs:
  - list
  - watch
- apiGroups:
  - batch
  resources:
  - cronjobs
  - jobs
  verbs:
  - list
  - watch
- apiGroups:
  - autoscaling
  resources:
  - horizontalpodautoscalers
  verbs:
  - list
  - watch
- apiGroups:
  - authentication.k8s.io
  resources:
  - tokenreviews
  verbs:
  - create
- apiGroups:
  - authorization.k8s.io
  resources:
  - subjectaccessreviews
  verbs:
  - create
- apiGroups:
  - policy
  resources:
  - poddisruptionbudgets
  verbs:
  - list
  - watch
- apiGroups:
  - certificates.k8s.io
  resources:
  - certificatesigningrequests
  verbs:
  - list
  - watch
- apiGroups:
  - storage.k8s.io
  resources:
  - storageclasses
  - volumeattachments
  verbs:
  - list
  - watch
- apiGroups:
  - admissionregistration.k8s.io
  resources:
  - mutatingwebhookconfigurations
  - validatingwebhookconfigurations
  verbs:
  - list
  - watch
- apiGroups:
  - networking.k8s.io
  resources:
  - networkpolicies
  verbs:
  - list
  - watch
cluster-role-binding.yaml
apiVersion: rbac.authorization.k8s.io/v1
kind: ClusterRoleBinding
metadata:
  labels:
    app.kubernetes.io/name: kube-state-metrics
    app.kubernetes.io/version: v1.9.7
  name: kube-state-metrics
roleRef:
  apiGroup: rbac.authorization.k8s.io
  kind: ClusterRole
  name: kube-state-metrics
subjects:
- kind: ServiceAccount
  name: kube-state-metrics
  namespace: ops-monit
deployment.yaml
apiVersion: apps/v1
kind: Deployment
metadata:
  labels:
    app.kubernetes.io/name: kube-state-metrics
    app.kubernetes.io/version: v1.9.7
  name: kube-state-metrics
  namespace: ops-monit
spec:
  replicas: 1
  selector:
    matchLabels:
      app.kubernetes.io/name: kube-state-metrics
  template:
    metadata:
      labels:
        app.kubernetes.io/name: kube-state-metrics
        app.kubernetes.io/version: v1.9.7
    spec:
      containers:
      - image: quay.mirrors.ustc.edu.cn/coreos/kube-state-metrics:v1.9.7
        livenessProbe:
          httpGet:
            path: /healthz
            port: 8080
          initialDelaySeconds: 5
          timeoutSeconds: 5
        name: kube-state-metrics
        ports:
        - containerPort: 8080
          name: http-metrics
        - containerPort: 8081
          name: telemetry
        readinessProbe:
          httpGet:
            path: /
            port: 8081
          initialDelaySeconds: 5
          timeoutSeconds: 5
      nodeSelector:
        beta.kubernetes.io/os: linux
      serviceAccountName: kube-state-metrics
service.yml
apiVersion: v1
kind: Service
metadata:
  labels:
    app.kubernetes.io/name: kube-state-metrics
    app.kubernetes.io/version: v1.9.7
  name: kube-state-metrics
  namespace: ops-monit
spec:
  clusterIP: None
  ports:
  - name: http-metrics
    port: 8080
    targetPort: http-metrics
  - name: telemetry
    port: 8081
    targetPort: telemetry
  selector:
    app.kubernetes.io/name: kube-state-metrics
创建ssl证书
如果前后端使用http,则这一步可以跳过。
如果前后端使用https,则prometheus也需要使用https方式。那么在后面的 ingress 中,需要配置tls,里面需要用到证书。所以使用 openssl 创建一个自签名证书。
openssl genrsa -out secret.key 2048
openssl req -new -x509 -key secret.key -out secret.crt -subj /C=CN/ST=Shanghai/L=Shanghai/O=DevOps/CN=xxx.xxx.com
其中,域名使用自己的域名。执行完之后,生成了 secret.crt 和 secret.key 两个文件。

之后执行如下命令创建 secret。这里偷懒了不像写yaml了,直接执行命令创建。
kubectl create secret tls prometheus-secret --cert=secret.crt --key=secret.key -n ops-monit

Prometheus
主要cAdvisor指标
指标有很多,这里只列举几个
| 参数 | 单位 | 说明 |
| container_cpu_usage_seconds_total | 秒(s) | 容器累计占用的CPU时间总和,单位是秒。多核情况下,每核都会有一个CPU时间总和,使用时需要将多核的CPU时间相加 |
| container_spec_cpu_quota | 容器的CPU配额。值 = 容器指定的CPU个数 * 100000。 本文计算CPU使用率时没有用到此指标。 grafana计算时用到了 |
|
| container_memory_rss | bytes | 容器实际使用的物理内存 |
| container_memory_working_set_bytes | bytes | 当前内存工作集(working set)使用量 |
拉取镜像
# prometheus镜像
prom/prometheus
配置文件 configmap.yml & prometheus.yml
prometheus.yml 是 prometheus 的核心配置文件。
configmap 是 kubernetes 的一种资源对象,kubernetes 通过 ConfigMap 来实现对容器中应用的配置管理。
这里把 prometheus.yml 中的内容,配置导 configmap 中,方面随时修改,替换 prometheus 镜像中的默认 prometheus.yml 配置文件。
apiVersion: v1
kind: ConfigMap
metadata:
  name: prometheus-configmap
  labels:
    name: prometheus-configmap
  namespace: ops-monit
data:
  prometheus.yml: |-
    # 全局配置,抓取数据间隔60s(根据实际情况设置)
    global:
      scrape_interval: 60s
      evaluation_interval: 60s

    scrape_configs:
      - job_name: 'kubernetes-apiservers'
        kubernetes_sd_configs:
        - role: endpoints
        scheme: https
        tls_config:
          ca_file: /var/run/secrets/kubernetes.io/serviceaccount/ca.crt
        bearer_token_file: /var/run/secrets/kubernetes.io/serviceaccount/token
        relabel_configs:
        - source_labels: [__meta_kubernetes_namespace, __meta_kubernetes_service_name, __meta_kubernetes_endpoint_port_name]
          action: keep
          regex: default;kubernetes;https

      - job_name: 'k8s-cadvisor'
        metrics_path: /metrics/cadvisor
        kubernetes_sd_configs:
        - role: node
        relabel_configs:
        - source_labels: [__address__]
          regex: '(.*):10250'
          replacement: '${1}:10255'
          target_label: __address__
          action: replace
        - action: labelmap
          regex: __meta_kubernetes_node_label_(.+)
        metric_relabel_configs:
        - source_labels: [instance]
          separator: ;
          regex: (.+)
          target_label: node
          replacement: $1
          action: replace

        - source_labels: [pod_name]
          separator: ;
          regex: (.+)
          target_label: pod
          replacement: $1
          action: replace

        - source_labels: [container_name]
          separator: ;
          regex: (.+)
          target_label: container
          replacement: $1
          action: replace

      - job_name: kube-state-metrics
        kubernetes_sd_configs:
        - role: endpoints
          namespaces:
            names:
            - ops-monit
        relabel_configs:
        - source_labels: [__meta_kubernetes_service_label_app_kubernetes_io_name]
          regex: kube-state-metrics
          replacement: $1
          action: keep
        - action: labelmap
          regex: __meta_kubernetes_service_label_(.+)
        - source_labels: [__meta_kubernetes_namespace]
          action: replace
          target_label: k8s_namespace
        - source_labels: [__meta_kubernetes_service_name]
          action: replace
          target_label: k8s_sname
prometheus-deployment.yml
真正的prometheus服务
注意指定configmap
apiVersion: apps/v1beta2
kind: Deployment
metadata:
  name: prometheus-deployment
  namespace: ops-monit
spec:
  replicas: 1
  selector:
    matchLabels:
      app: prometheus-dep
  template:
    metadata:
      #annotations:
       # prometheus.io/scrape: true
      labels:
        app: prometheus-dep
    spec:
      # 指定节点,pod会分配到此节点上。
      nodeName: 10.68.4.66
      containers:
      - image: prom/prometheus
        imagePullPolicy: IfNotPresent
        name: prometheus-container
        command:
        - "/bin/prometheus"
        args:
        - "--config.file=/etc/prometheus/prometheus.yml"
        - "--storage.tsdb.path=/prometheus"
        - "--storage.tsdb.retention=24h"
        ports:
        - containerPort: 9090
          protocol: TCP
        volumeMounts:
        - mountPath: /etc/prometheus
          name: config-volume
        - mountPath: /etc/localtime
          name: localtime
      volumes:
      - name: config-volume
        configMap:
          name: prometheus-configmap
      - name: localtime
        hostPath:
          path: /etc/localtime
prometheus-service.yml
如果使用 https,则还需要部署 ingress
apiVersion: v1
kind: Service
metadata:
  name: prometheus-service
  namespace: ops-monit
spec:
  ports:
  - port: 9090
    targetPort: 9090
  selector:
    app: prometheus-dep
如果使用http,则使用 NodePort模式
apiVersion: v1
kind: Service
metadata:
  name: prometheus-service
  namespace: ops-monit
spec:
  type: NodePort
  ports:
  - port: 9090
    targetPort: 9090
    nodePort: 30003
  selector:
    app: prometheus-dep
prometheus-ingress.yml
ingress用来对外暴露prometheus服务。service只能在集群内部访问,浏览器上无法访问。通过 ingress 来将服务暴露出去,这样浏览器上就能访问到服务了。
apiVersion: extensions/v1beta1
kind: Ingress
metadata:
  name: prometheus-ingress
  namespace: ops-monit
  annotations:
    kubernetes.io/ingress.class: "nginx"
spec:
  tls:
  - hosts:
    - xxx.xxx.com
    secretName: prometheus-secret
  rules:
  - host: xxx.xxx.com
    http:
      paths:
      - path: /api
        backend:
          serviceName: prometheus-service
          servicePort: 9090
安装Grafana并使用
grafana提供给管理员使用,可以查看kubernetes集群内所有容器的监控信息。
这里图省事直接用docker部署。
# 拉取镜像
docker pull grafana/grafana# 创建容器
docker run -d --name=grafana -p 3000:3000 grafana/grafana
添加数据源
Configuration -> Data Sources
选择 Prometheus 类型的数据源
填写URL,这个URL就是 Prometheus 的路径:
- https:https://xxx.xxx.com 需勾选"Skip TLS Verify"
- http:http://xx.xx.xx.xx:30003 不用勾选"Skip TLS Verify"
然后点击"Save & Test"
当提示 "Data source is working",说明数据源绑定成功!

创建dashboard仪表盘
Grafana Labs 地址:Dashboards | Grafana Labs
这里有许许多多的 dashboard,选择一个适合自己的。由于我要监控的是 kubernetes 的容器,所以选择了 ID 为 13105 的仪表盘。
13105 dashboard 地址:https://grafana.com/grafana/dashboards/13105
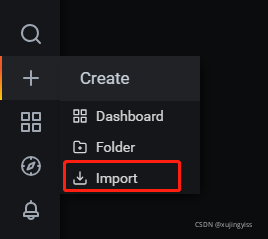
下载 json 文件,然后导入:


dashboard 导入完成后,就可以通过 grafana 查看 kubernetes 容器监控信息了。
上方可以通过节点、命名空间、容器名、POD名进行筛选,也可以调整时间区间进行查询。

java后端
由于我的项目前后端都是用的https,所以prometheus也需要使用https,因为https网站内不可以发送http请求。而我使用的证书是通过openssl生成的自签名证书,是不被浏览器承认的,所以如果直接在前端工程中向prometheus发送请求,会提示连接不安全,最终无法获取数据。所以把发送请求的操作放到后端,后端可以实现"信任所有证书"的功能。
如果前后端没有使用 https,那么 prometheus 可以部署为 http,则不需要后端了,可以在前端直接请求 prometheus 获取数据。
从prometheus查询数据
要从 prometheus 中查询数据,需要使用 PromQL 语法。不过也没时间学这语法了,偷个懒直接取grafana上的查询语句。。。

ContainerMetrics
@Data
public class ContainerMetrics {
    private String jobName;
    private Long start;
    private Long end;
    private Integer step;
    private Integer cpuLimit;
    private String cpuUsage;
    private String cpuTotalUsage;
    private Double cpuCore;
    private String wss;
    private String rss;
    private String diskUsage;
}
HttpClientUtil
发送http请求。
@Slf4j
public class HttpClientUtil {
    public static String get(String httpUrl) {
        String result = "";
        try (CloseableHttpClient httpClient = HttpClientBuilder.create().build()) {
            HttpGet request = new HttpGet(httpUrl);
            try (CloseableHttpResponse response = httpClient.execute(request)) {
                HttpEntity responseEntity = response.getEntity();
                if (responseEntity != null){
                    result = EntityUtils.toString(responseEntity,"utf-8");
                    log.info("响应内容:" + result);
                }
            }
        } catch (IOException e) {
            e.printStackTrace();
        }
        return result;
    }

    public static String httpsGet(String httpsUrl) {
        String result = "";
        try (CloseableHttpClient httpClient = createSSLClientDefault()) {
            HttpGet request = new HttpGet(httpsUrl);
            try (CloseableHttpResponse response = httpClient.execute(request)) {
                HttpEntity responseEntity = response.getEntity();
                if (responseEntity != null){
                    result = EntityUtils.toString(responseEntity,"utf-8");
                    log.info("响应内容:");
                    log.info(result);
                }
            }
        } catch (IOException e) {
            e.printStackTrace();
        }
        return result;
    }

    public static CloseableHttpClient createSSLClientDefault() {
        try {
            // 使用 loadTrustMaterial() 方法实现一个信任策略,信任所有证书
            SSLContext sslContext = new SSLContextBuilder()
                    .loadTrustMaterial(null, (chain, authType) -> true).build();
            // NoopHostnameVerifier类:  作为主机名验证工具,
            // 实质上关闭了主机名验证,它接受任何有效的SSL会话并匹配到目标主机
            HostnameVerifier hostnameVerifier = NoopHostnameVerifier.INSTANCE;
            SSLConnectionSocketFactory sslsf
              = new SSLConnectionSocketFactory(sslContext, hostnameVerifier);
            return HttpClients.custom().setSSLSocketFactory(sslsf).build();
        } catch (Exception e) {
            e.printStackTrace();
        }
        return HttpClients.createDefault();
    }
}
MetricsController
@RestController
@RequestMapping("/metrics")
@Slf4j
public class MetricsController {

    @Value("${prometheus.url}")
    private String prometheusUrl;

    @GetMapping("/container")
    public ContainerMetrics queryResourceMetrics(ContainerMetrics containerMetrics) {
        ContainerMetrics metrics = new ContainerMetrics();

        String cpuPercentQuery = buildQueryUrl(CPU_PERCENT_QUERY, containerMetrics);
        String cpuPercentResult = HttpClientUtil.httpsGet(cpuPercentQuery);
        MetricsResult cpuPercent = JSON.parseObject(cpuPercentResult, MetricsResult.class);
        if (checkResult(cpuPercent)) {
            String value = cpuPercent.getData().getResult()[0].getValue()[1];
            double cpuUsage = new BigDecimal(Double.valueOf(value)).setScale(2, BigDecimal.ROUND_HALF_UP).doubleValue();
            double cpuTotalUsage = new BigDecimal(cpuUsage * containerMetrics.getCpuLimit()).setScale(2, BigDecimal.ROUND_HALF_UP).doubleValue();
            metrics.setCpuUsage(cpuUsage + "%");
            metrics.setCpuTotalUsage(cpuTotalUsage + "%");
        }

        String cpuCoreQuery = buildQueryUrl(CPU_CORE_QUERY, containerMetrics);
        String cpuCoreResult = HttpClientUtil.httpsGet(cpuCoreQuery);
        MetricsResult cpuCore = JSON.parseObject(cpuCoreResult, MetricsResult.class);
        if (checkResult(cpuCore)) {
            String value = cpuCore.getData().getResult()[0].getValue()[1];
            double core = new BigDecimal(Double.valueOf(value)).setScale(2, BigDecimal.ROUND_HALF_UP).doubleValue();
            metrics.setCpuCore(core);
        }

        String memoryWssQuery = buildQueryUrl(MEMORY_WSS_QUERY, containerMetrics);
        String memoryWssResult = HttpClientUtil.httpsGet(memoryWssQuery);
        MetricsResult memoryWss = JSON.parseObject(memoryWssResult, MetricsResult.class);
        if (checkResult(memoryWss)) {
            metrics.setWss(bytesToGib(memoryWss.getData().getResult()[0].getValue()[1]));
        }

        String memoryRssQuery = buildQueryUrl(MEMORY_RSS_QUERY, containerMetrics);
        String memoryRssResult = HttpClientUtil.httpsGet(memoryRssQuery);
        MetricsResult memoryRss = JSON.parseObject(memoryRssResult, MetricsResult.class);
        if (checkResult(memoryRss)) {
            metrics.setRss(bytesToGib(memoryRss.getData().getResult()[0].getValue()[1]));
        }

        String diskUsageQuery = buildQueryUrl(DISK_USAGE_QUERY, containerMetrics);
        String diskUsageResult = HttpClientUtil.httpsGet(diskUsageQuery);
        MetricsResult diskUsage = JSON.parseObject(diskUsageResult, MetricsResult.class);
        if (checkResult(diskUsage)) {
            metrics.setDiskUsage(bytesToGib(diskUsage.getData().getResult()[0].getValue()[1]));
        }

        return metrics;
    }

    @GetMapping("/cpuUsage")
    public String queryCpuUsage(ContainerMetrics containerMetrics) {
        String httpsUrl = buildQueryRangeUrl(CPU_USAGE_QUERY, containerMetrics);
        return HttpClientUtil.httpsGet(httpsUrl);
    }

    @GetMapping("/wss")
    public String queryMemoryWss(ContainerMetrics containerMetrics) {
        String httpsUrl = buildQueryRangeUrl(MEMORY_WSS_QUERY, containerMetrics);
        return HttpClientUtil.httpsGet(httpsUrl);
    }

    @GetMapping("/rss")
    public String queryMemoryRss(ContainerMetrics containerMetrics) {
        String httpsUrl = buildQueryRangeUrl(MEMORY_RSS_QUERY, containerMetrics);
        return HttpClientUtil.httpsGet(httpsUrl);
    }

    private String buildQueryUrl(String query, ContainerMetrics containerMetrics) {
        try {
            query = query.replaceAll("k8s-job-name", containerMetrics.getJobName());
            String url = prometheusUrl + "/api/v1/query?query="
                    + URLEncoder.encode(query, "UTF-8") + "&time=" + containerMetrics.getEnd();
            return url;
        } catch (UnsupportedEncodingException e) {
            return "";
        }
    }

    private String buildQueryRangeUrl(String query, ContainerMetrics containerMetrics) {
        try {
            query = query.replaceAll("k8s-job-name", containerMetrics.getJobName());
            String url = prometheusUrl + "/api/v1/query_range?query=" + URLEncoder.encode(query, "UTF-8")
                    + "&start=" + containerMetrics.getStart()
                    + "&end=" + containerMetrics.getEnd()
                    + "&step=" + containerMetrics.getStep();
            return url;
        } catch (UnsupportedEncodingException e) {
            return "";
        }
    }

    private boolean checkResult(MetricsResult result) {
        return result != null && result.getData().getResult().length > 0
                && StringUtils.isNotEmpty(result.getData().getResult()[0].getValue()[1]);
    }

    private String bytesToGib(String value) {
        long bytes = Long.valueOf(value);
        if (bytes < 10737418) {
            return "0";
        } else {
            return new BigDecimal(bytes / 1073741824).setScale(2, BigDecimal.ROUND_HALF_UP).doubleValue() + "GB";
        }
    }

    private static final String CPU_PERCENT_QUERY = "sum(rate(container_cpu_usage_seconds_total{origin_prometheus=~\"\",container =~\"k8s-job-name\",container !=\"\",container!=\"POD\",namespace=~\"training\"}[2m])) by (container) / (sum(container_spec_cpu_quota{origin_prometheus=~\"\",container =~\"k8s-job-name\",container !=\"\",container!=\"POD\",namespace=~\"training\"}/100000) by (container)) * 100";

    private static final String CPU_CORE_QUERY = "sum(rate(container_cpu_usage_seconds_total{origin_prometheus=~\"\",container =~\"k8s-job-name\",container !=\"\",container!=\"POD\",namespace=~\"training\"}[2m])) by (container)";

    private static final String MEMORY_WSS_QUERY = "sum (container_memory_working_set_bytes{origin_prometheus=~\"\",container =~\"k8s-job-name\",container !=\"\",container!=\"POD\",namespace=~\"training\"}) by (container)";

    private static final String MEMORY_RSS_QUERY = "sum (container_memory_rss{origin_prometheus=~\"\",container =~\"k8s-job-name\",container !=\"\",container!=\"POD\",namespace=~\"training\"}) by (container)";

    private static final String DISK_USAGE_QUERY = "sum(container_fs_usage_bytes{origin_prometheus=~\"\",container =~\"k8s-job-name\",container !=\"\",container!=\"POD\",namespace=~\"training\"}) by (container)";

    private static final String CPU_USAGE_QUERY = "sum(rate(container_cpu_usage_seconds_total{origin_prometheus=~\"\",container =~\"k8s-job-name\",container !=\"\",container!=\"POD\",namespace=~\"training\"}[2m])) by (container) / (sum(container_spec_cpu_quota{origin_prometheus=~\"\",container =~\"k8s-job-name\",container !=\"\",container!=\"POD\",namespace=~\"training\"}/100000) by (container)) * 100";

}
前端展示
根据需求,我需要在我自己的平台上展示容器资源信息,所以光有grafana还是不够,我需要自己从prometheus获取指标数据,然后再前端绘制出折线图。
前端框架用的是vue,绘制图表使用echart组件,所以需要先安装好echart组件。
最终效果:

由于前端代码比较分散,所以只贴出两个echart图表相关的关键代码:
<template>
  <div>
    <div id="cpuUsageChart" class="chart-common"></div>
    <div id="memoryChart" class="chart-common"></div>
  </div>
</template>
script 中导入一些关键的组件
let echarts = require('echarts/lib/echarts')
require('echarts/lib/chart/pie')
require('echarts/lib/component/tooltip')
require('echarts/lib/component/title')
import { LineChart } from 'echarts/charts';
echarts.use([LineChart]);
import { LegendComponent,GridComponent,ToolboxComponent } from 'echarts/components';
echarts.use([LegendComponent]);
echarts.use([GridComponent]);
echarts.use([ToolboxComponent]);
定义data:
其中 xxxOption.xAxis.data 是X轴的数据,xxxOption.series[0].data 是Y轴的数据。这需要在从 prometheus 中获取数据后填入。
cpuUsageOption: {
  title: {
	text: '容器整体CPU使用率',
	subtext: '单位:%'
  },
  tooltip: {
	trigger: 'axis'
  },
  grid: {
	left: '3%',
	right: '4%',
	bottom: '3%',
	containLabel: true
  },
  xAxis: {
	type: 'category',
	data: []
  },
  yAxis: {
	type: 'value'
  },
  series: [
	{
	  type: 'line',
	  data: []
	}
  ]
},
memoryOption: {
  title: {
	text: '容器内存使用量',
	subtext: '单位:GB'
  },
  tooltip: {
	trigger: 'axis',
  },
  legend: {
	data: ['Wss', 'Rss']
  },
  grid: {
	left: '3%',
	right: '4%',
	bottom: '3%',
	containLabel: true
  },
  xAxis: {
	type: 'category',
	boundaryGap: false,
	data: []
  },
  yAxis: {
	type: 'value'
  },
  series: [
	{
	  name: 'Wss',
	  type: 'line',
	  symbol: 'none',
	  data: []
	},
	{
	  name: 'Rss',
	  type: 'line',
	  symbol: 'none',
	  data: []
	}
  ]
}
页面初始化的时候发送请求查询数据。
这里从response中取出来的数据格式跟上面后端代码不完全匹配,不过这不是重点,毕竟每个人前端写法都不大一样。
initEChart() {
  let time = new Date().getTime() + ''
  let end = Number(time.substr(0, 10)) // 注意是精确到秒,不是毫秒
  let start = end - 86400 // 86400表示1天,具体时间间隔自己设置

  let params = {
	jobName: this.jobName,  // 由于我的容器是通过kubernetes的job创建的,这里是job的名称,不是pod的名称
	start: start,
	end: end,
	step: 60
  }
  this.queryMetricsCpuUsage(params)
  this.queryMetricsMemory(params)
},
queryMetricsCpuUsage(param) {
  this.queryMetricsCpuUsage_api(param).then((res) => {
	if (res.status === 200) {
	  let result = JSON.parse(res.data.result)
	  if (result.data.result.length > 0 && result.data.result[0].values) {
		let values = result.data.result[0].values
		let x_data = new Array();
		let y_data = new Array();
		for(let i=0;i<values.length;i++) {
		  x_data[i] = this.formatTimestamp(values[i][0])
		  y_data[i] = Number(values[i][1]).toFixed(2)
		}
		this.cpuUsageOption.xAxis.data = x_data
		this.cpuUsageOption.series[0].data = y_data
	  } else {
		this.cpuUsageOption.xAxis = {
		  type: 'category',
		  boundaryGap: false,
		  data: []
		}
		this.cpuUsageOption.series = [
		  {
			type: 'line',
			data: []
		  }
		]
	  }
      // 绘制图表
	  let cpuUsageChart = echarts.init(document.getElementById('cpuUsageChart'))
	  cpuUsageChart.setOption(this.cpuUsageOption)
	}
  })
},
queryMetricsMemory(params) {
  this.queryMetricsWSS_api(params).then((res) => {
	if (res.status === 200) {
	  let resultWSS = JSON.parse(res.data.result)
	  if (resultWSS.data.result[0].values) {
		let values = resultWSS.data.result[0].values
		let x_data = new Array();
		let y_data = new Array();
		for(let i=0;i<values.length;i++) {
		  x_data[i] = this.formatTimestamp(values[i][0])
		  y_data[i] = this.bytesToGib(values[i][1])
		}
		this.memoryOption.xAxis.data = x_data
		this.memoryOption.series[0].data = y_data

		this.queryMetricsRSS_api(params).then((res) => {
		  if (res.status === 200) {
			let resultRSS = JSON.parse(res.data.result)
			if (resultRSS.data.result[0].values) {
			  let values = resultRSS.data.result[0].values
			  let y_data = new Array();
			  for(let i=0;i<values.length;i++) {
				y_data[i] = this.bytesToGib(values[i][1])
			  }
			  this.memoryOption.series[1].data = y_data
              // 绘制图表
			  let memoryChart = echarts.init(document.getElementById('memoryChart'))
			  memoryChart.setOption(this.memoryOption)
			}
		  }
		})
	  }
	}
  })
},
formatTimestamp (timestamp) {
  let date = new Date(timestamp * 1000)
  let h = (date.getHours() < 10 ? '0' + date.getHours() : date.getHours()) + ':'
  let m = (date.getMinutes() < 10 ? '0' + date.getMinutes() : date.getMinutes())
  return h + m
},
bytesToGib(bytes) {
  if (bytes < 10737418) return 0;
  let gib = Number(bytes / 1073741824).toFixed(2)
  return gib
}
到这里就差不多写完了。当然,可以获取的指标远远不止这些,可以参考grafana中的查询语句,再进行自行扩展。
智能推荐
LINUX学习-用C语言实现FTP项目_linux 下c语言开发ftp下载工具-程序员宅基地
文章浏览阅读3.2k次,点赞3次,收藏23次。FTP(File Transfer Protocol,文件传输协议) 是 TCP/IP 协议组中的协议之一。FTP协议包括两个组成部分,其一为FTP服务器,其二为FTP客户端。其中FTP服务器用来存储文件,用户可以使用FTP客户端通过FTP协议访问位于FTP服务器上的资源。在开发网站的时候,通常利用FTP协议把网页或程序传到Web服务器上。此外,由于FTP传输效率非常高,在网络上传输大的文件时,..._linux 下c语言开发ftp下载工具
【小白必胜-xpath】lxml.etree.HTML(),lxml.etree.fromstring()和lxml.etree.tostring()三者的区别与联系_html.fromstring()含义-程序员宅基地
文章浏览阅读3.5k次,点赞5次,收藏30次。对于使用xpath()之前的文档格式化问题,可能不同的人,会遇到不一样的情况,但是基本上只要搞懂了lxml.etree.HTML(),lxml.etree.fromstring()和lxml.etree.tostring()这三者之间的区别和联系,那么文档格式化这一步一定不会有问题……_html.fromstring()含义
Android过渡动画基础使用_gradentdrawable过渡-程序员宅基地
文章浏览阅读2k次。前言Android从API19引入了Transition过渡动画框架,它通过场景Scene概念来表述动画的关键帧,只要提供了开始和结束场景的内容就会自动做动画。过渡动画其实是对属性动画的一种封装,它能够一次对多个对象做动画而不需要特别复杂的配置。除此之外Activity之间的切换效果也可以使用过渡动画来实现。基础使用首先需要定义Scene也就是场景对象,场景其实就是某个事件点所有的..._gradentdrawable过渡
h2ouve工具使用_GitHub - sha310139/Edit_BIOS_Setting_Interface: H2OUVE是使用command修改BIOS設定的工具,此介面結合H2OUVE,對...-程序员宅基地
文章浏览阅读4.7k次。Edit_BIOS_Setting_Interface簡介H2OUVE是個可透過command的方式修改BIOS設定的工具,我們利用Python3撰寫一個簡易的介面,透過H2OUVE去修改BIOS的設定,省去使用者一一下指令並修改設定檔的麻煩。當多台server需套用同一個BIOS設定時,只要先針對一台電腦修改所需的BIOS設定,匯出設定檔後,即可透過deploy kit執行這個程式,讓多台ser..._h2ouve
超时尚的UI电子商务PSD分层模板,临摹学习必备-程序员宅基地
文章浏览阅读124次。用户体验或更准确地说,电子商务用户体验(UX)是所有UI的重要方面,在处理电子商务应用程序时是必需的。当前,电子商务业务变得越来越有竞争力,各种各样的选择使客户忠诚度成为无可挑剔的现象。UX主要是指用户在操作电子商务网站时的体验。UX封装了用户在经营电子商务商店时所经历的一系列印象,包括可访问性,便利性,满意度等。拥有“好”用户体验是指用户可以高效,愉快地满足其需求的情况。此外,用户体验优化与转化化不同。尽管UX优化的重点是满意度,可用性和将其推荐给朋友的热情等指标,但其他形式的优化却着眼于提高
Ubuntu18.04安装Cartographer_error: cannot launch node of type [cartographer_ro-程序员宅基地
文章浏览阅读3.4k次,点赞5次,收藏44次。你好你好#include <iostream>using namespace std;int main(int argc, char* argv[]){ return 0;}_error: cannot launch node of type [cartographer_ros/cartographer_node]: cart
随便推点
RUST——封装的实现_rust 封装-程序员宅基地
文章浏览阅读685次。rust对象封装学习笔记_rust 封装
DSP_TMS320F2802x_CMPSS逐波限流功能实现_dsp逐波限流-程序员宅基地
文章浏览阅读4.6k次,点赞4次,收藏49次。此功能为了使过流时进行单拍电流进行封波设定,实现逐波限流 DAC->COMP->DCEVT->TZ.CBC(1)Comp 设定如下:AIO->COMPGpioCtrlRegs.AIOMUX1.bit.AIO2 = 0; // Configure AIO2 for CMP1A (analog input) operationComp1Regs.COMPCTL.bit.SYNCSEL = 1; // Sync with SYSCLK / use Qualif._dsp逐波限流
对留学最有用的8种英语考试_哪类考试单词到了国外贴合日常使用-程序员宅基地
文章浏览阅读1k次。 1. IELTS 中文通常译作“雅思”,是前往英联邦国家留学或移民参加的一种英语水平考试。考试内容分移民类(G类)和学术类(A类),包括听、说、读、写四部分。G类与A类只在阅读和写作两个单项上有区别,考试形式为笔试,满分为9分,中国学生的成绩集中于4-7分之间。英语全称: International English Language Testing System 考试时间: 16_哪类考试单词到了国外贴合日常使用
C++ map的常用用法(超详细)(*^ー^)人(^ー^*)_c++ map用法-程序员宅基地
文章浏览阅读3.8w次,点赞146次,收藏735次。map常用操作详细讲解_c++ map用法
EmEditor 主题 Minimal_emeditor主题-程序员宅基地
文章浏览阅读3.5k次。本风格源自MinimalZen风格修改,存为Minimal.eetheme,在EmEditor导入后选中即可。工具 => 所有配置属性 => 显示 => 主题 => 导入 => 是否移除旧主题,选“否” => 下来选择 Minimal 主题 => 确定[Minimal]MaxFind=3Normal=#a9b7c6,#2b2b2b,normal..._emeditor主题
C++学习笔记——C++中四个点代表什么意思?_c++四个点什么意思-程序员宅基地
文章浏览阅读8k次,点赞5次,收藏6次。问:C++中四个点代表什么意思? 答: 表示类的成员。(你说的是两个冒号“:”吧) 如类CA中有成员int a; 则:CA::a表示CA类中的成员a; 举个例子: class CA { int a; int b(); }; 那么:函数int b();的定义就必须是这样的: int CA::b() { //… }..._c++四个点什么意思